Close
Leave Feedback
Welcome to the new btim.com.auTake a two minute tour to see what we've changed
Hi there! Welcome to the new look Pendal website... Take a two minute tour to see what we’ve changed.
Mainstream Online Web Portal
LoginInvestors can view their accounts online via a secure web portal. After registering, you can access your account balances, periodical statements, tax statements, transaction histories and distribution statements / details.
Advisers will also have access to view their clients’ accounts online via the secure web portal.
Private debt vs. public bonds: why it’s time to re-examine the traditional role of fixed income
Private credit has its place in portfolios. So do bonds. As rates normalise, investors would do well to remember those roles are different, writes Pendal head of income strategies Amy Xie Patrick
- Asset classes like private credit have important roles to play in portfolios
- Why bonds, why now? Pendal’s income and fixed interest experts explain
- Browse Pendal’s fixed interest funds
INCREASINGLY I find myself a lone voice on conference panels speaking in favour of public market debt offerings such as bonds.
When I look left and right, I see experts in private credit, private equity, unlisted property and venture capital.
Depending on your investment goals, there are solid reasons for each of these to feature in a portfolio.
But I generally disagree with the use of private debt to replace the job that active bonds are supposed to do in a portfolio.
What is private debt (otherwise known as private credit or direct lending)?
Private debt is a type of credit.
Credit is a sub-asset class of fixed income where companies are borrowers and investors are lenders.
In the public debt space these loans take the shape of bonds or syndicated loans.
Both are freely-traded instruments whose values may change with every transaction. Sometimes, in the absence of any transaction, prices can change as market conditions change.
On the other hand, private debt is lending undertaken directly between companies and investors.
Borrowers are typically companies looking for more advantageous terms than they can get from a bank.
These companies may face more onerous bank lending terms due to lower credit quality, an unproven business concept or the riskiness of a project.
Investors include private debt funds, insurance companies and so on.
In Australia, private debt funds benefit from the conservative nature of our major banks. This leaves a significant slice of smaller and medium-sized enterprises “unbanked”.
It also provides a return opportunity for private debt managers who have the risk appetite and capability to assess and manage the risks.
As a result, private credit portfolios are able to generate higher levels of yield and income than portfolios of investment-grade corporate bonds.
Unprecedented growth
Five-to-ten years ago most private debt funds in Australia would have had only 20-30% exposure to the residential property market.
An unprecedented period of strong inflows into these funds followed as end investors searched for yield in a low-interest-rate world.
Today, the average private debt portfolio in Australia would have 50% or more exposure to the residential market.
This alters the risk and compositions of these portfolios compared to more diversified positions a decade ago.
Growth in these exposures has been forced rather than intended, since there haven’t been enough non-property opportunities to participate in.
In the world of equities, small and micro-cap fund managers are usually frank about the capacity of their offerings.
Good managers will cap the growth of their funds to sizes commensurate with the liquidity and the likely pool of good opportunities in their market.
Private debt funds have generally not done this in the face of strong inflows.
As a result, I expect the overall quality of portfolios will continue to get dragged by the concentration in property.
No volatility
Lack of market volatility is another attraction of private debt funds over publicly traded bonds.
This was a particularly strong draw after 2022 when most asset classes other than cash and oil were under water.
Why is there no volatility? Because there is next to no liquidity in private debt.
From time to time, private debt positions may transition between different fund managers. But these are bilaterally arranged deals unseen by the rest of the market.
Even if a manager sells a position from her portfolio to another manager at a sub-par value, it does not force every other private debt manager to take a paper loss on similar assets in their portfolios.
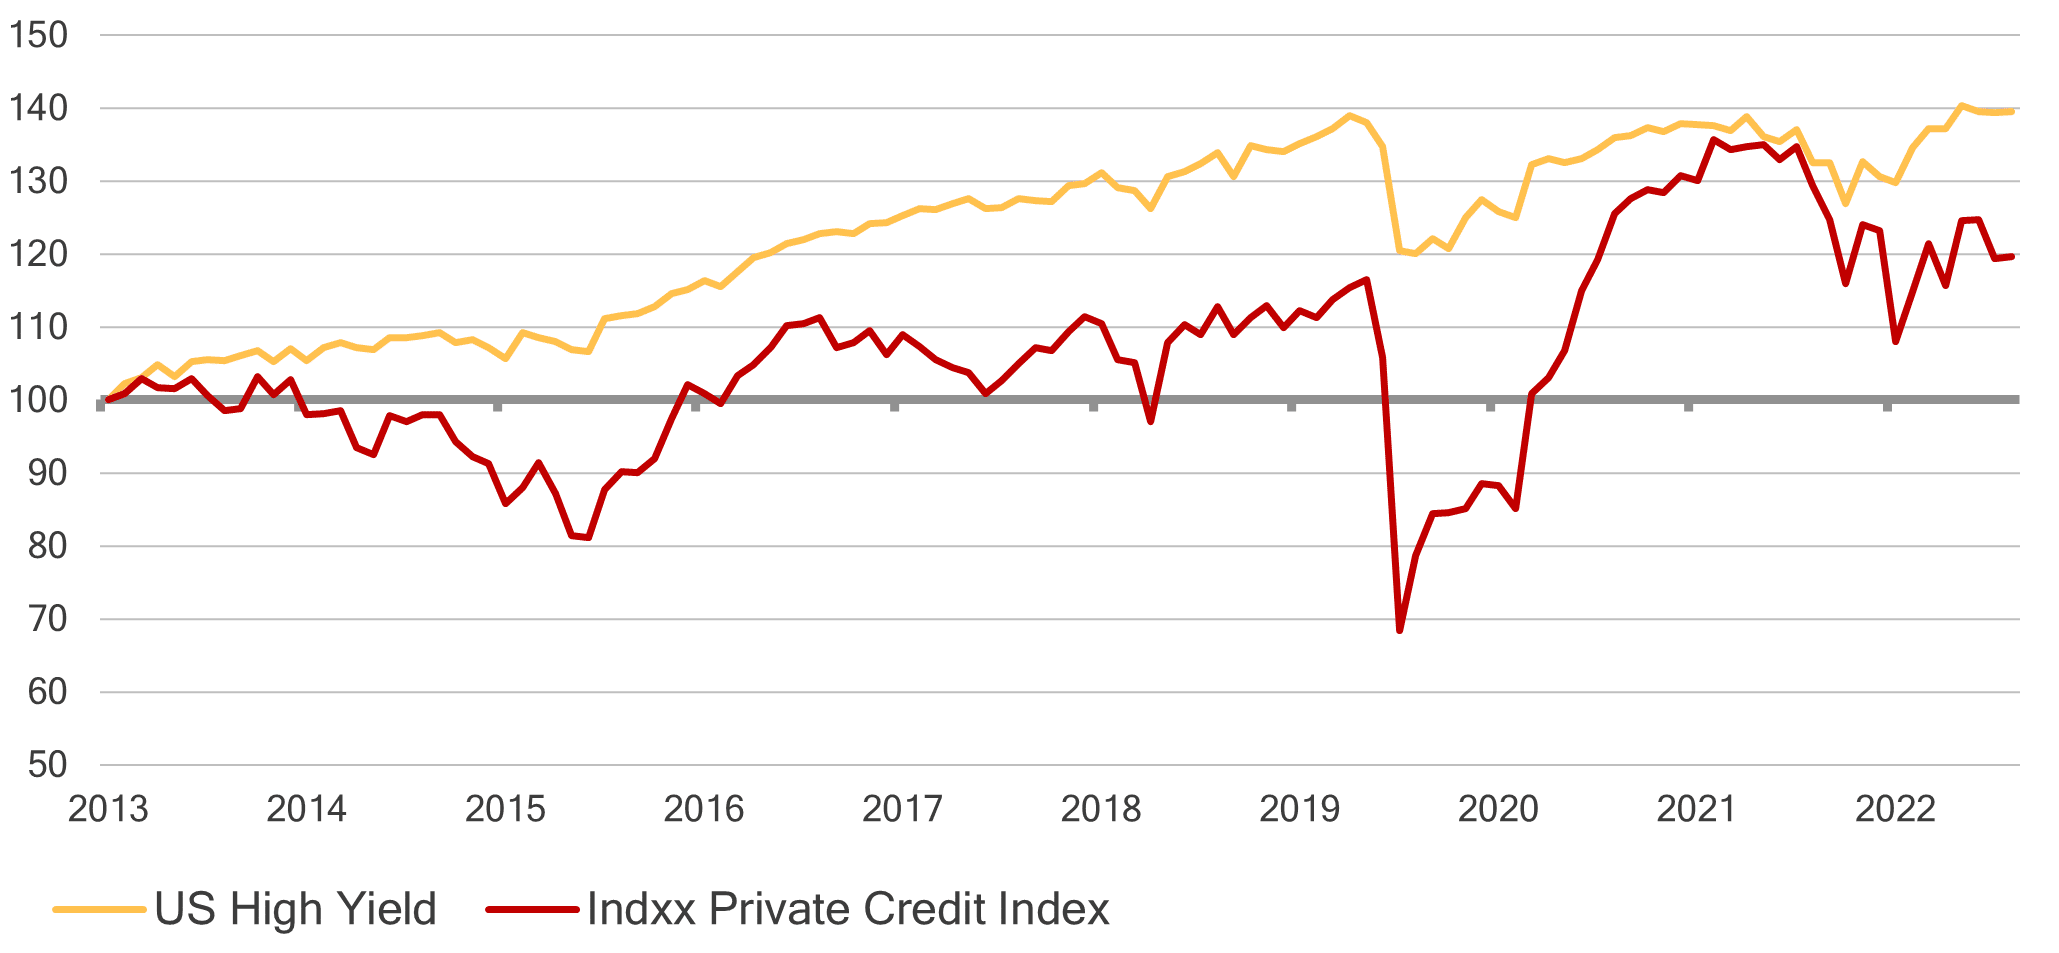
By no means does the red line in Figure 1 (see below) paint the lived experience of every private debt investor.
But it reminds us that just because something doesn’t move, that doesn’t mean it’s sellable at the price it was bought.
Figure 1: What if private debt were publicly traded? US high yield and an index of asset managers who specialise in private debt
Source: Bloomberg
Of course, no private credit index has enough history to tell us anything reliable about the true volatility of the sub-asset class.
But we can consider the red line above as a proxy.
It tracks the share prices of listed companies whose main business is in direct lending and private credit.
It’s no surprise that the undulations of the red line follow those of public high-yield markets. But the draw-downs are deeper, reflecting greater risks in private debt.
Historically, this has been true of every private version of asset classes, from debt to equity to property.
A cyclical asset class
The market volatility makes sense when you see that private debt is a cyclical asset class.
Figure 2: The cyclicality of private debt
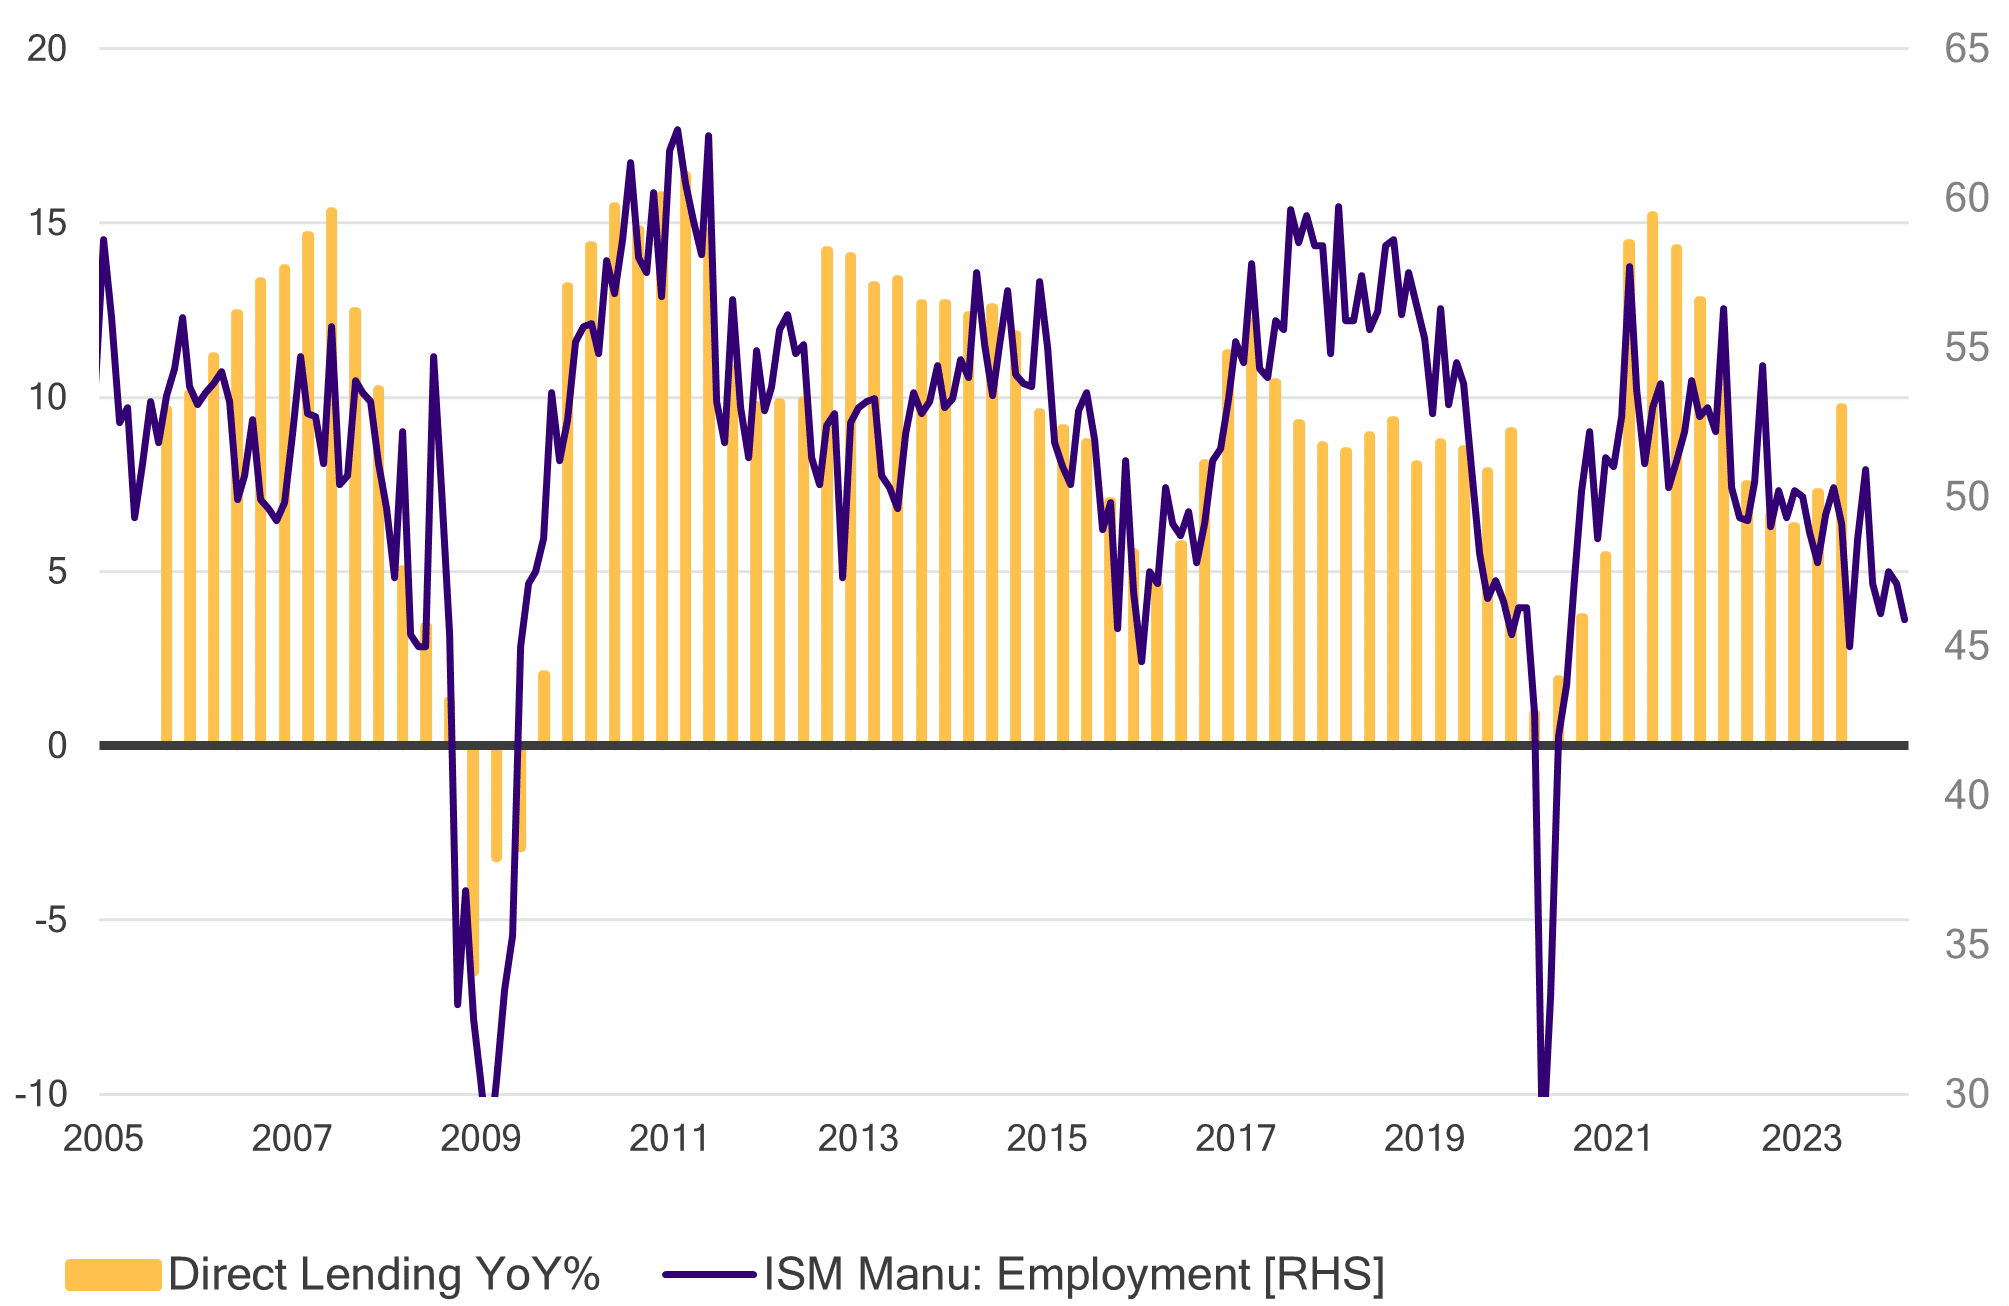
Source: Bloomberg
This direct-lending data comes from the Cliffwater Direct Lending Total Return Index.
The index measures the unlevered and gross-of-fee performance of US direct loans by looking at the asset-weighted performance of the underlying assets of the direct-lending companies.
The ISM manufacturing employment index signals cyclical trends in the overall economy. When overlaid to the year-over-year returns of the Cliffwater index, we can see the returns to direct lending follow the cycle.
The data for the latest periods of returns from US direct lending are not yet available. But we can see from the ISM index that the trajectory of those returns are likely to be headed lower as the economic cycle softens.
Government bonds, on the other hand, have always rallied into every economic recession.
There has been a long-held relationship between the quits rate and wages.
Valuations
Rather than speculate about private debt valuations and methodology, I’d look to recent findings from KBRA Direct Lending Deals on the state of valuations ahead of defaults among the US community of private debt managers.
The same data is currently unavailable in Australia, but the KBRA analysis references a US$1.7 trillion industry.
The study addresses a key assertion of the private debt industry that they are in stronger lender positions than banks.
The reasoning includes closer relationships with companies, more senior positions in the capital structure and stronger protections when borrowers get into trouble.
If that were true, you should expect that recovery rates on defaulted positions in private credit portfolios should have an average value in excess of what is achieved in public bond and loan markets.
The KBRA results showed the opposite.
Private credit firms were able to recover only 48 per cent of the value of loans made to defaulted companies over the last year, compared to 55 per cent in syndicated loans.
The seniority and protected position assertions may also lead managers and valuation agents to be overly optimistic when assessing potential loss in their portfolios.
Figure 3: Mind the gap. Private vs public debt valuations ahead of defaults
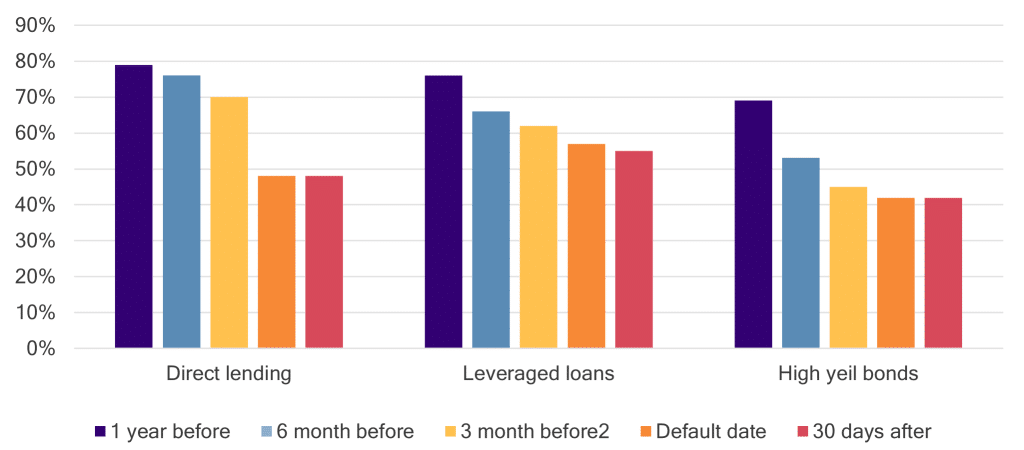
Source: Bloomberg
As Figure 3 illustrates, in the three months leading up to default, direct-lending portfolios tend to mark troubled assets at a higher value than both the markets of leveraged loans and high-yield bonds.
The phenomenon may be more simply explained by the wisdom of crowds.
Given many market participants are looking at the same thing in leveraged loans and high-yield bonds, there are more opinions weighing in on what the right asset value should be at any point in time.
In private debt, it’s usually just the opinion of the manager and a third-party valuation agent.
The dangers of private debt replacing traditional fixed income
Even the most conservative private debt managers in Australia will have a higher level of credit risk through their portfolios than a bond or credit manager.
In addition, even the most liquid of private debt funds will not be able to offer daily liquidity for their clients.
I highlight these two points because I think they get to the heart of how most investors see the role of fixed income in their portfolios.
At the very least, it is a part of the portfolio that they don’t expect to worry about when their equities, property and Bitcoins are falling out of bed.
Most investors also expect to be able to tap their fixed income allocations for some liquidity once their cash has been used up.
In orderly normal market sell-offs, high-quality investment grade bonds offered for sale by one manager will usually find a home with another – even if it’s at a lower price that the former would like.
Perhaps the same can be said of private debt, though the discounts would have to be far steeper.
This highlights the need for some non-credit fixed income in the portfolio as well. This is where exposure to government bonds comes in.
Government bonds don’t have to be defensive.
The experience of 2022 reminded markets that bonds move as much with inflation as they do with growth. Since inflation was the bigger problem then, bonds could not rally as equities sold off.
If growth becomes the bigger problem, bonds should perform – just as they have in every recession in the past. This has been regardless of the starting point in yields.
Recession is the worst-feared scenario for equities, property and probably Bitcoin. It is also the worst-feared scenario for leveraged and private credit because corporate defaults skyrocket.
As KRBA’s findings have shown, the relatively benign valuations on private debt portfolios may only mask the impending shock to come in such an environment.
With most private credit funds requiring investors to provide two-to-four months’ notice on capital redemptions, that may be just the perfect amount of time for the value of their investments to go from whole to sub-par.
Conclusions
Asset classes such as private credit have important roles to play in portfolios.
They provide a way to amplify returns – and in some cases even diversify the sources of those returns.
In times of ultra-low interest rates, the space they occupy in portfolios have grown to crowd out traditional fixed income.
But now that interest rates have normalised, it is time to ask whether traditional fixed income needs to find its way back in.
If fixed income is supposed to be the true diversifier – with an ability to protect or defend in times of economic stress – private debt will not fulfil that purpose.
If fixed income is supposed to be a source of liquidity in times of market stress, a greater consideration needs to be made for government bonds.
That liquidity was available even in the depths of severe financial crises.
It proved invaluable for investors who used that flexibility to take advantage of beaten down prices in other asset classes.
Again, private credit will not serve investors well who are in need of that liquidity or flexibility in those stressed market environments.
It’s been easy to get away with replacing private debt for traditional fixed income for a decade. Let’s not wait for a deeper episode of economic stress to remind ourselves of the value of bonds.
About Amy Xie Patrick and Pendal’s Income and Fixed Interest team
Amy is Pendal’s Head of Income Strategies. She has extensive experience and expertise in emerging markets, global high yield and investment grade credit and holds an honours degree in economics from Cambridge University.
Pendal’s Income and Fixed Interest boutique is one of the most experienced and well-regarded fixed income teams in Australia. Pendal won the 2023 Sustainable and Responsible Investments (Income) category in the Zenith awards. In 2021 the team won Lonsec’s Active Fixed Income Fund of the Year Award.
The team oversees some $20 billion invested across income, composite, pure alpha, global and Australian government strategies.
Find out more about Pendal’s fixed interest strategies here
About Pendal Group
Pendal is a global investment management business focused on delivering superior investment returns for our clients through active management.
This information has been prepared by Pendal Fund Services Limited (PFSL) ABN 13 161 249 332, AFSL No 431426 and is current at March 27, 2024.
PFSL is the responsible entity and issuer of units in the Pendal Monthly Income Plus Fund (ARSN: 137 707 996) and Pendal Dynamic Income Fund (ARSN: 622 750 734) (Funds). A product disclosure statement (PDS) is available for the Funds and can be obtained by calling 1300 346 821 or visiting www.pendalgroup.com. The Target Market Determination (TMD) for the Funds is available at www.pendalgroup.com/ddo. You should obtain and consider the PDS and the TMD before deciding whether to acquire, continue to hold or dispose of units in the Funds.
An investment in the Funds or any of the funds referred to in this web page is subject to investment risk, including possible delays in repayment of withdrawal proceeds and loss of income and principal invested.
This information is for general purposes only, should not be considered as a comprehensive statement on any matter and should not be relied upon as such. It has been prepared without taking into account any recipient’s personal objectives, financial situation or needs. Because of this, recipients should, before acting on this information, consider its appropriateness having regard to their individual objectives, financial situation and needs. This information is not to be regarded as a securities recommendation.
The information may contain material provided by third parties, is given in good faith and has been derived from sources believed to be accurate as at its issue date. While such material is published with necessary permission, and while all reasonable care has been taken to ensure that the information is complete and correct, to the maximum extent permitted by law neither PFSL nor any company in the Pendal group accepts any responsibility or liability for the accuracy or completeness of this information.
Performance figures are calculated in accordance with the Financial Services Council (FSC) standards. Performance data (post-fee) assumes reinvestment of distributions and is calculated using exit prices, net of management costs. Performance data (pre-fee) is calculated by adding back management costs to the post-fee performance. Past performance is not a reliable indicator of future performance.
Any projections are predictive only and should not be relied upon when making an investment decision or recommendation. While we have used every effort to ensure that the assumptions on which the projections are based are reasonable, the projections may be based on incorrect assumptions or may not take into account known or unknown risks and uncertainties. The actual results may differ materially from these projections.
For more information, please call Customer Relations on 1300 346 821 8am to 6pm (Sydney time) or visit our website www.pendalgroup.com
Keep updated
Sign up to receive the latest news and views