Winners, losers and the naysayers in FY17

There were clear winners and losers in 2016/17, both at an asset class and investment-specific level. Share investments were the place to be but badly timing when to buy and sell could have resulted in very different outcomes. Trump, Brexit, Frexit, Nexit and no exit (in the case of Italy’s constitutional referendum) proved to be powerful shorter term disruptors to the loosely defined normal conditions for investment markets. But all’s well that ends well appropriately characterises the year in investment markets. Here’s a summary of the key market developments over the past year together with insights from our investment teams.
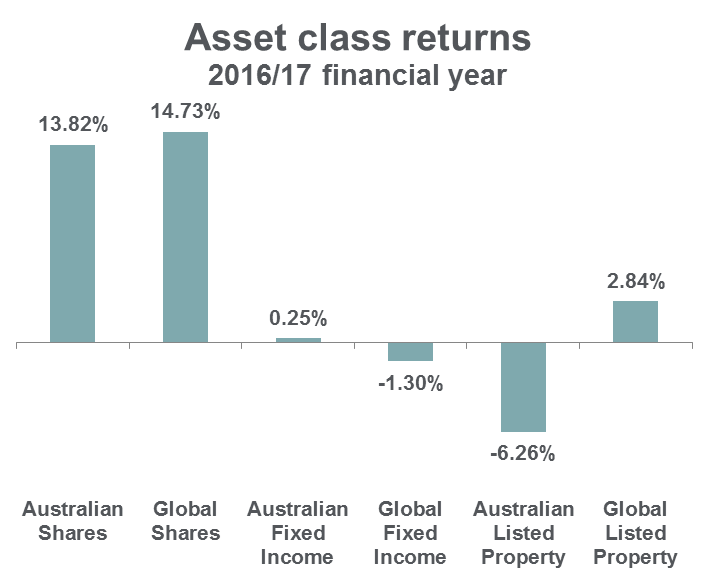
*Asset class returns shown above are based on appropriate index returns. Australian Shares: S&P/ASX 300 Accumulation Index; Global Shares: MSCI World Total Return (A$) Index; Australian Fixed Income: Bloomberg AusBond Composite (0+yr) Index; Global Fixed Income: JP Morgan GBI Global Traded A$ Hedged Index; Australian Listed Property: S&P/ASX 200 A-REIT Accumulation Index; Global Listed Property: FTSE EPRA/NAREIT Developed ex Australia (A$ hedged) Total Return Index.
Australian shares
Australia’s share market marched ahead despite temporary rattlings from offshore. Share markets commenced the financial year in uncertain and unprecedented territory with the surprise outcome of the Brexit vote. Shares then staged a short term rebound and oscillated within a tight range before establishing a positive trend to end the year with a 13.8%1 return.
Ironically, investors have Donald Trump to thank for some of the market’s gains this financial year. Despite mixed views on his candidacy, the notion of an expansionary policy agenda provided markets with renewed belief in future growth and helped the market to advance in a less volatile manner.
Within the major sub-components there was a fair degree of dispersion. Resource shares outpaced their industrial counterparts, supported by a strong rise in the iron ore price. However, the rising trend ended in March when this key component of steel manufacturing began a precipitous decline. Growing concerns over China’s true economic health and hence the underlying demand for Australia’s key commodity eased the enthusiasm for resources.
Industrial shares as a group lagged the resources sector, although there was a wide range of winners and losers. Among the best performers were Qantas (+111%) and BlueScope Steel (+109%) while specific stocks to avoid included Ten Network (-82%), Vita Group (-78%) and Reject Shop (-64%).
“The market overall is fairly valued but there are still very attractive stock specific opportunities. These include ResMed with its new product releases, JB Hi-Fi and its successful integration of the Good Guys business which will deliver synergies and margin expansion, and Metcash which is well placed with strong management, a clear turnaround strategy and solid free cash flow that underpins a strong dividend.”
Andrew Waddington
Portfolio Manager – Australian Equities
Listed property
Constant murmurs of bubble, bust and burn for Australian residential property persisted through the year, although this had little bearing on the A-REIT market. Many of the established names in this sector did well, with retail property companies the notable exception. Scentre Group (-14%), owner and operator of Westfield stores in Australia and New Zealand, its US and UK stores equivalent, Westfield Corporation (-22%) and Vicinity Centres (-18%) were the stocks to avoid. The direct link to a lacklustre consumer weighed down by debt and low wage growth had a material impact on the sector.
The broader A-REIT sector remains attractive, offering a solid yield of 4-5% and earnings growth of 3-4%, making it a valuable component of diversified portfolios.
Global shares
In the US, share market returns were largely driven by the so-called FANG stocks – Facebook, Amazon, Netflix and Google. Add Apple and Microsoft to the mix and these stocks have each delivered returns ranging from 28% to 58%.
While the big tech and media stocks drove the US market higher over the past year, there are great opportunities at the moment outside of the mega cap stocks. The 10 largest stocks in the US only represent only about 15% of the US$28 trillion US stock market.
“Always look beyond the popular stocks, there are a plethora of quality companies with the potential to become ‘the next leaders’. Find them, assess them…and invest with patience.”
Ashley Pittard
Head of Global Equities
Elsewhere, most major European and Asia-Pacific markets delivered healthy double-digit returns, aided by the low interest rate environment and recovering economic fundamentals. Market valuations may appear to be extreme but we argue there is still good value in many companies and investors need to be very selective.
Fixed Income
Despite widespread expectations of negative returns, Australian fixed income posted a small positive gain in 2016/17, with a 0.25% return. Globally, central banks have kept interest rates low and flushed the market with liquidity. Returns across the major overseas bond markets ranged from -1% to -4.5%, with the global fixed income asset class as a whole returning -1.3% . The Australian dollar was a relatively strong performer, appreciating against the US dollar, euro, British pound and Japanese yen over the year. Although returns were muted across the government sector, credit investments performed well as they benefitted from strong share market performance.
“Fixed income is a core asset class and will continue to play an important role within a diversified portfolio, particularly in the event of increasing volatility in the share markets, which shouldn’t be discounted in the current environment.”
Vimal Gor
Head of Income & Fixed Interest
1. S&P/ASX 300 Accumulation Index
2. Bloomberg AusBond Composite (0+yr) Index
3. JPMorgan GBI Global Traded A$ Hedged Index

This article has been prepared by Pendal Fund Services Limited (PFSL) ABN 13 161 249 332, AFSL No 431426 and the information contained within is current as at July 5, 2017. It is not to be published, or otherwise made available to any person other than the party to whom it is provided.
This article is for general information purposes only, should not be considered as a comprehensive statement on any matter and should not be relied upon as such. It has been prepared without taking into account any recipient’s personal objectives, financial situation or needs. Because of this, recipients should, before acting on this information, consider its appropriateness having regard to their individual objectives, financial situation and needs. This information is not to be regarded as a securities recommendation.
The information in this article may contain material provided by third parties, is given in good faith and has been derived from sources believed to be accurate as at its issue date. While such material is published with necessary permission, and while all reasonable care has been taken to ensure that the information in this article is complete and correct, to the maximum extent permitted by law neither PFSL nor any company in the Pendal group accepts any responsibility or liability for the accuracy or completeness of this information.
Performance figures are calculated in accordance with the Financial Services Council (FSC) standards. Performance data (post-fee) assumes reinvestment of distributions and is calculated using exit prices, net of management costs. Performance data (pre-fee) is calculated by adding back management costs to the post-fee performance. Past performance is not a reliable indicator of future performance.
Any projections contained in this article are predictive and should not be relied upon when making an investment decision or recommendation. While we have used every effort to ensure that the assumptions on which the projections are based are reasonable, the projections may be based on incorrect assumptions or may not take into account known or unknown risks and uncertainties. The actual results may differ materially from these projections.